
This Page gather some experimentation made with the line() function of p5.js.
Made a custom function to draw line from center with lenght and angle as argument, way more convenient for consistency in pattern using cos and sine to give movement across the picture. Rewrapping a function with different arguments will lead to new results (change the process, change the outcome)
function linec(cx,cy, lenght, angle){

  a = sin (angle*(PI/180)) * (lenght/2);
  print(a);
  b = cos (angle*(PI/180)) * (lenght/2);
  print(b);
  x1 = cx + a;
  print(x1)
  y1 = cy + b;
  print(y1)
  x2 = cx - a;
  print(x2)
  y2 = cy - b;
  print(y2)

  line(x1, y1, x2, y2)
}
Angle and color related to the distance to a point (here the two points can be seen in purple).
function setup() {
  size = 800;
  division = 400 / 15;
  createCanvas(size+division, size+division);
  noLoop()
}

function draw() {
  z = 200
  background(250-z, 25-z, 65-z);
  strokeWeight(2);
  stroke(150, 50, 200);
  //strokeCap(SQUARE);

  for (let x = division; x<size-division; x+=division){

    for (let y = division; y<size-division; y+=division){

      distance = dist(x, y, 300, 50)/50;
      distance2 = dist(x, y, size/2+300, size-100)/50;

      //strokeWeight(max(min(min(distance, distance2), 3),2));
      d = (((min(distance, distance2)))*8)
      stroke(170-d, 100+d, 200-d, 255);
      x2 = max(cos((x/400)*10.3)*division+distance, 0);
      x2 = min(x2, division);
      x1 = max(sin((x/400)*2.3)*division+distance2, 0);
      x1 = min(x1, division);
      x2 += distance;
      x1 += distance2;
      hf=division/2;
      compx = sin(x/400*6.3)*10;
      compy = cos(y+100/400*6.3)*5;
      linec(x+hf+compy, y+hf, division, x1*2+(distance*20));
  }
}

//save()
//  linec(200, 200, 200, 180)

}

function linec(cx,cy, lenght, angle){

  a = sin (angle*(PI/180)) * (lenght/2);
  b = cos (angle*(PI/180)) * (lenght/2);
  x1 = cx + a;
  y1 = cy + b;
  x2 = cx - a;
  y2 = cy - b;

  line(x1, y1, x2, y2)
}
A focus point is placed in the bottom left, all lines defines their direction depending on their angle with this point. This picture has been printed and scanned to give it a bit more texture.

function setup() {
  size = 800;
  division = 400 / 15;
  createCanvas(size+division, size+division);
  noLoop()
}

function draw() {
 background(255)
  strokeWeight(2);

  for (let x = division*1.5; x<size-division; x+=division){
    for (let y = division*1.5; y<size-division; y+=division){
      frequence = 2000 ;// range 0 - 3000
      focusx = 140;
      focusy = 140;
      angle = getRad(x, y, focusx, focusy) * frequence;
      linec(x, y, division, angle);
  }
}

//save()
}

function linec(cx,cy, lenght, angle){

  a = sin (angle*(PI/180)) * (lenght/2);
  b = cos (angle*(PI/180)) * (lenght/2);
  x1 = cx + a;
  y1 = cy + b;
  x2 = cx - a;
  y2 = cy - b;

  line(x1, y1, x2, y2)
}

function getRad(x1, y1, x2, y2){
  angle = acos((x1-x2)/(dist(x1, y1, x2, y2)*3))
  return angle;
}
X and Y positions of each lines are offseted by a sin function

 offsety += sin((x / size)*10)*50;
 offsetx += sin((y / size)*15)*10+(x/10);
Modifying the behaviour depending on the quarter the line is in.
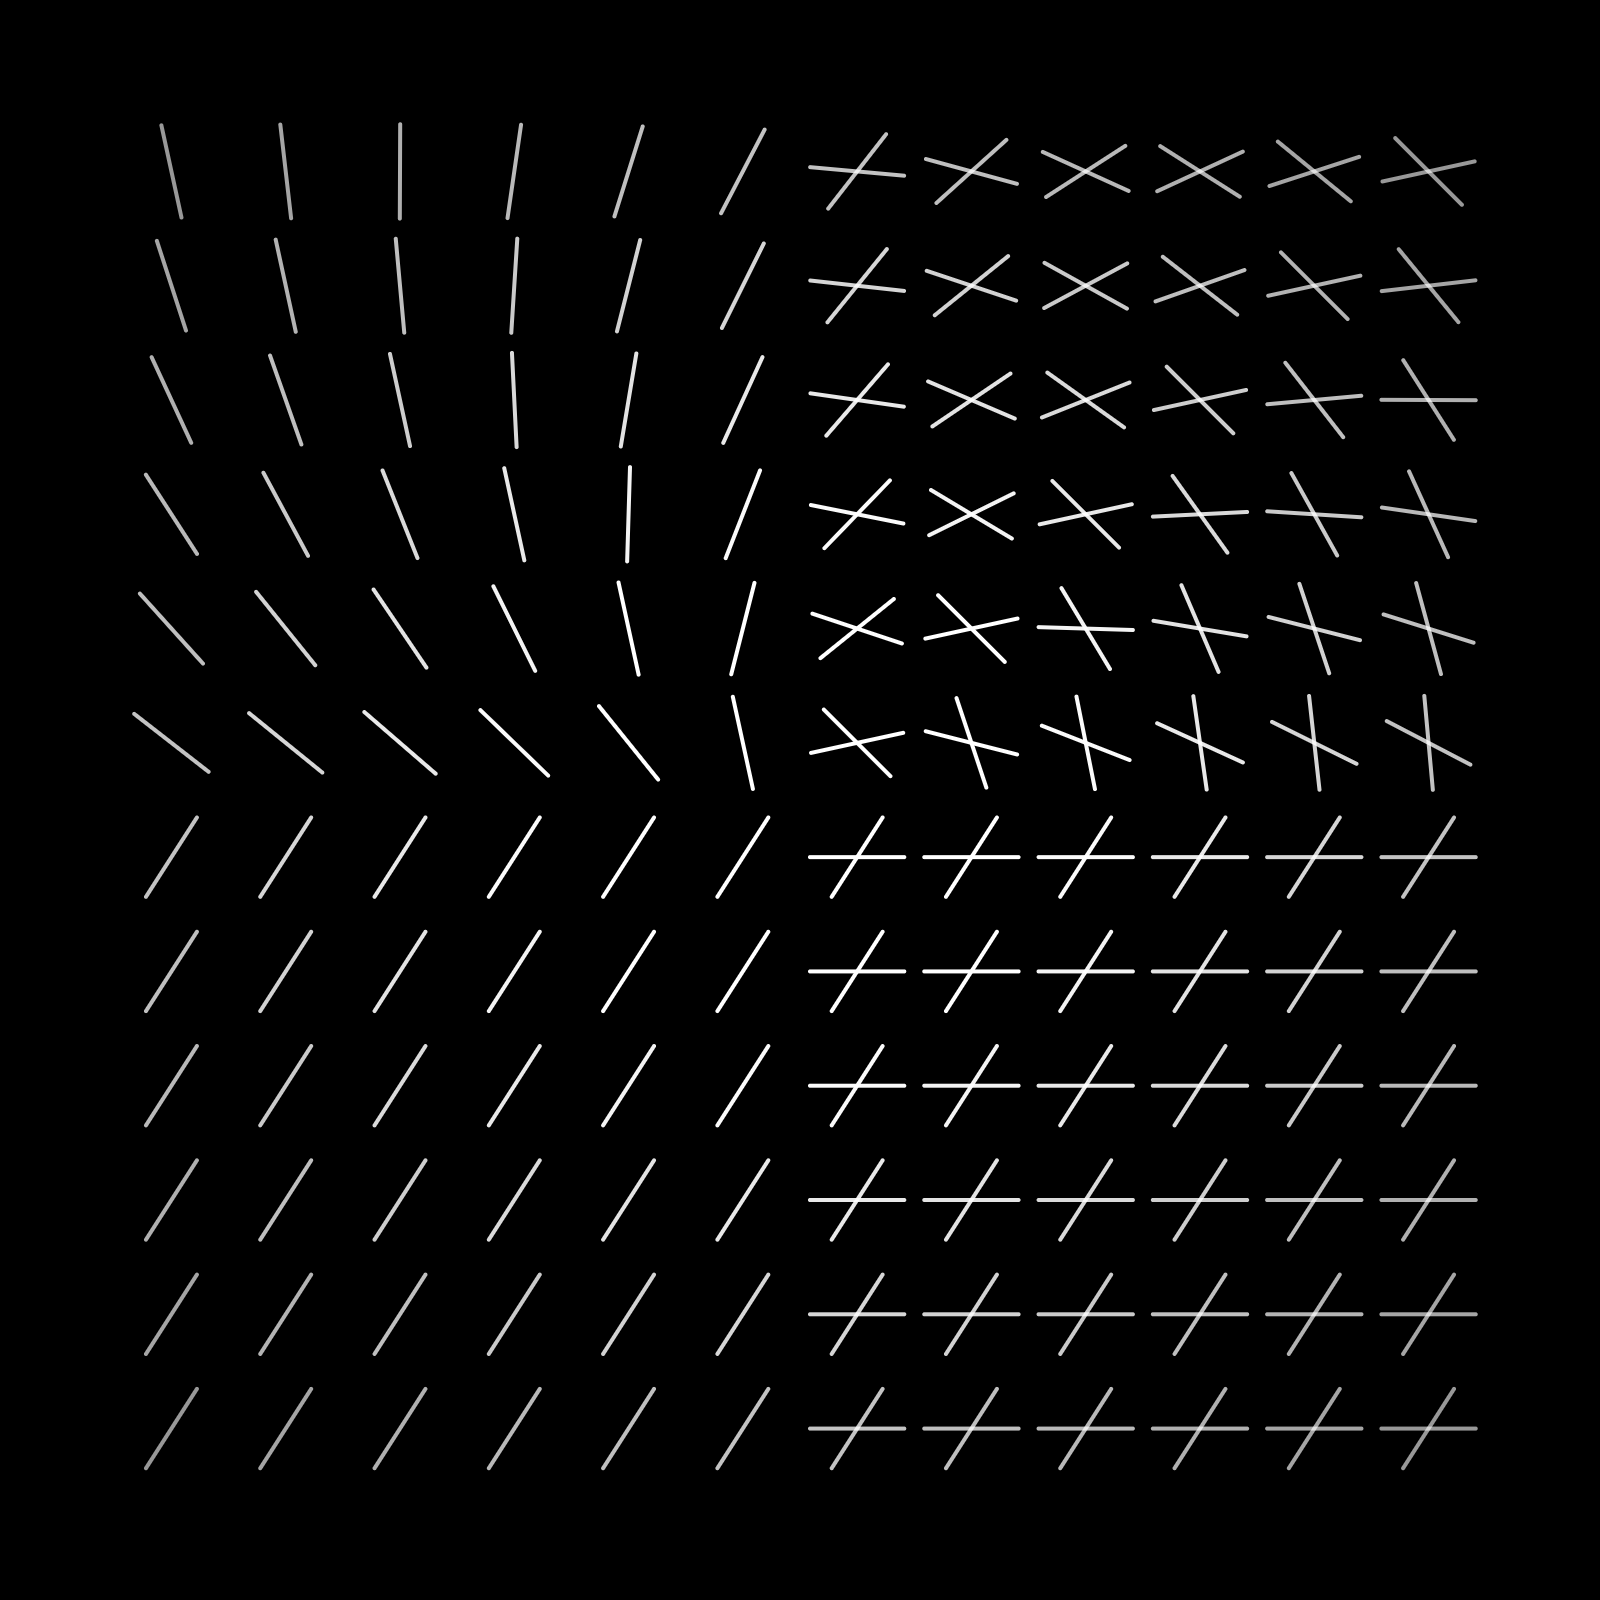
for (let x = div * 1.5; x < size - div; x += div) {
for (let y = div * 1.5; y < size - div; y += div) {
focusx = 400;
focusy = 400;
angle = getRad(x, y, focusx, focusy);
d = dist(x, y, focusx, focusy);
stroke(0, 0, 0, 300-d/3)
linec(x, y, div-10, angle+(PI/2)+1);
if (x>400){
linec(x, y, div-10, angle+(PI/2));
}}}